The main features of the urban structure visualization
- It is a 3D mapping tool, not 2D.
- Your Google Map quickly turns into a Statistical Map.
- You can compare different regions at the same level.
- This web site was featured in various media and materials such as Google Japan official blog and Special issue of The City Planning Institute of Japan.
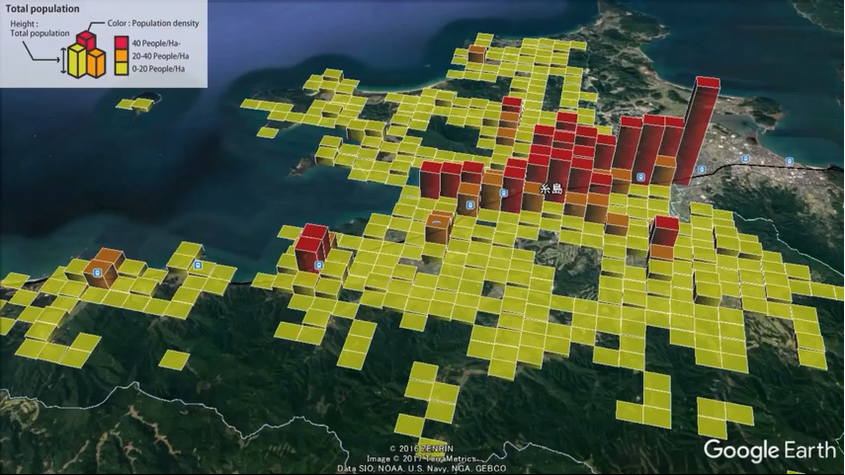
1. Display in three dimensions
By displaying the statistical data in three dimensions, it is possible to intuitively understand the urban structure.
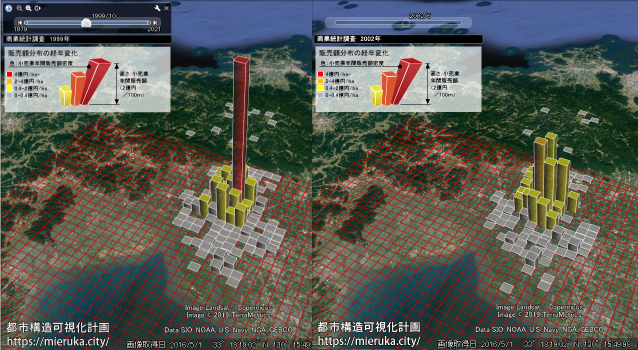
2. Secular change in the animation
As various statistical surveys are carried out on a regular basis, you can see the data of each survey year as a secular change.
The population of the central urban area is decreasing and spreading thinly around.
3. Display of cross analysis & Confirmation of Street View
Various analyses are possible by changing the data displayed by the mesh color and height, and it is also possible to identify statistically distinctive areas and to confirm the fields by integrating with Street View.
Color
・It shows the condition (position) of the place such as the public transportation use area and the area classification.
・As well as the height, numerical values indicating the quantity can also be indicated by classification.
Height
・It shows quantity (degree of integration) such as population and sales amount.
・The higher height is, the accumulation will be larger.
※Station use area: mesh including a range of 1km radius from the station
※Bus stop use area: mesh including a range of 300 m radius from the bus stop

コメント